
-
Bitcoin's Correlation To Risk Assets
 Sam Rule
 2023-02-19
 3395
3395 Research
AD
-
Summary:While many bitcoin investors look for the asset to behave as a safe haven, bitcoin typically has ultimately acted as the riskiest of all risk allocations.
Short-term price and long-term graduation thesis
In fact, the main performance of Bitcoin in the future is quite different from our long-term view rather than the trading rules in the market at this stage. In this article, we will deeply analyze the correlation risk and compare the profitability and correlation of Bitcoin and other asset classes.
Continuously, tracking and analyzing this correlation can help us better understand whether and when Bitcoin is really linked to the current development trend. You don't think that you are in this period now, but the probability of linkage will be very high in the next five years.
Macro-driven correlation
First of all, we are scientifically studying the correlation between Bitcoin and the single-day profits of many other assets. Finally, you want to know the trend of Bitcoin compared with other key asset classes. There are many opinions about what Bitcoin is and what it may be, but this is different from the way of trading Bitcoin.
The range of correlation ranges from negative one to negative one, which shows how strongly the two independent variables are related to each other. In your case, it is asset income. Typically, the strong correlation is higher than 0.75, and the medium correlation is higher than 0.5. The higher correlation indicates that assets are moving in the same direction, and the inverse ratio or negative correlation is just the opposite. A correlation of 0 indicates a neutral site or no specific correlation. Viewing the dialog box for a long time can better show the strength of the association, because this can eliminate the short-term and unstable transition.
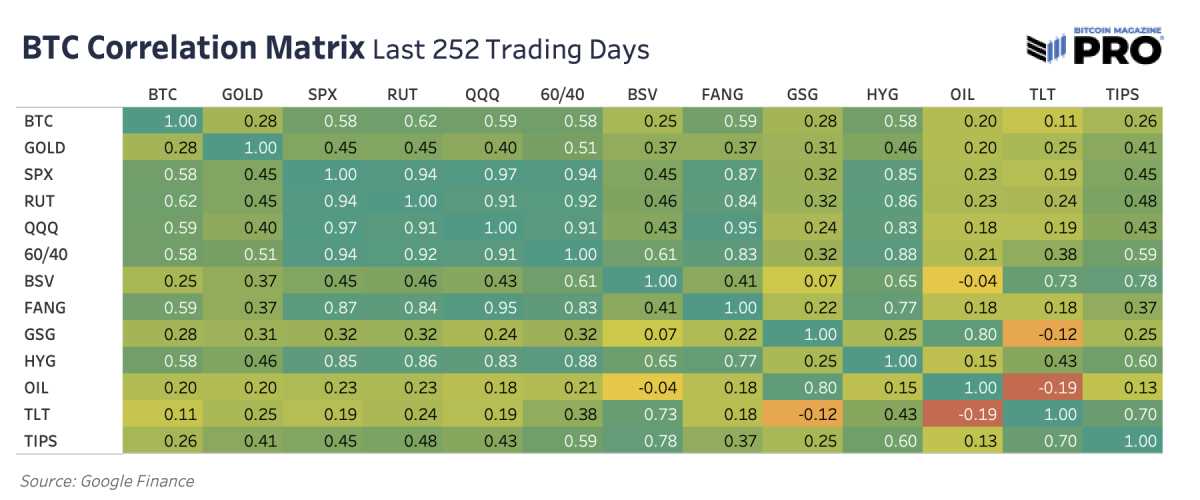
In the past few years, the most concerned correlation of Bitcoin is its correlation with "asset risk". Comparing Bitcoin with traditional asset classes and indexes in the past year or 252 trading days, Bitcoin is most relevant to many risk standards: S&P 500 index, Russell 2000 (low price stocks), QQQETF, HYG high return corporate bond ETF and FANG index (high growth high-tech). In fact, many of these indexes are highly correlated with each other, which shows how strong the correlation between all assets is under the current macroeconomic structure.
The following is a comparison between Bitcoin and some important asset class standards such as high beta, individual stocks, oil and bonds
Another important thing to note is that Bitcoin is traded on 24/7, but other assets and indexes are generally not. Because Bitcoin can be bought and sold at any time, it has been proved in the past that Bitcoin will also lead to a wider range of risk or liquidity market changes, so the correlation is likely to be ignored. With the improvement of the CME futures market of Bitcoin, the futures data can be used to buy and sell within the same time period as traditional assets, thus reducing the volatility of correlation over time.
Take a look at the three-month reversal correlation between Bitcoin CME futures trading and the above index risks. They are basically the same
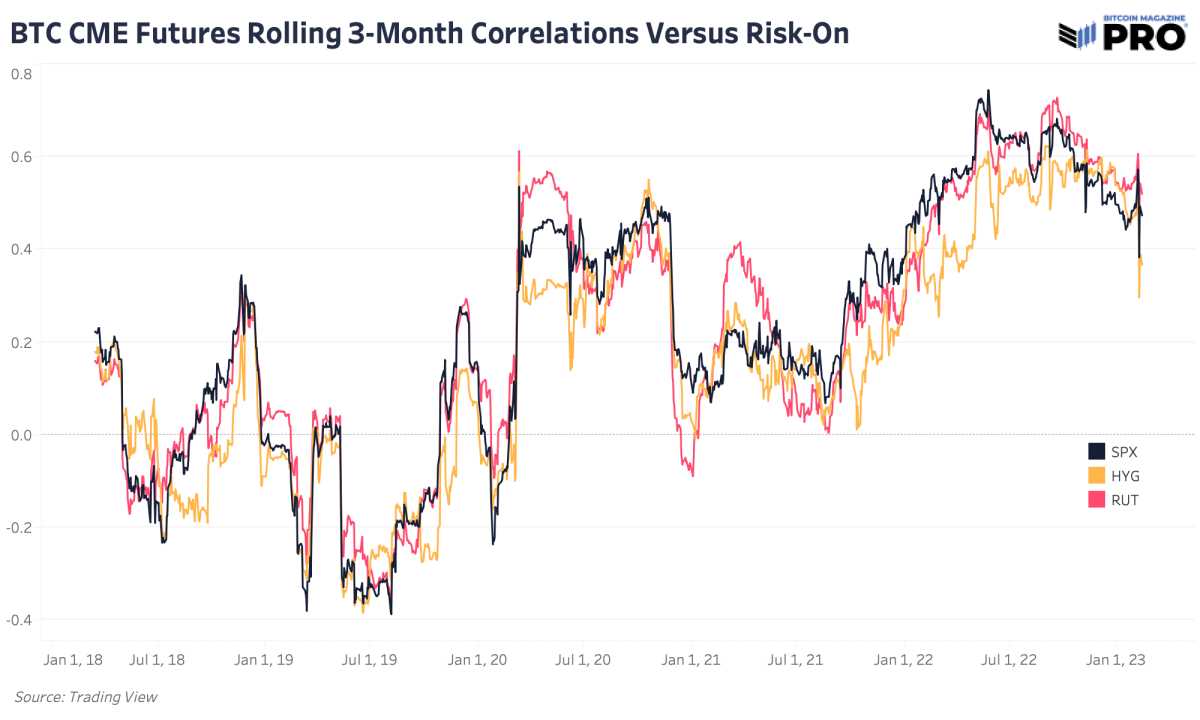
Although Bitcoin has its own capitulation and deleveraging events across the industry, compared with many milestone stops we have seen before, the relationship between these and traditional risks has not changed much.
Bitcoin has finally become one of the riskiest of all risk distributions, and is also a kind of liquidity sponge. It performs well when there is any sign of liquidity expansion in the market. Under the current market operation mechanism, there is no sign that the volatility rate of the stock market will rise.
With the acceleration of the understanding and selection of Bitcoin, we really expect that such dynamics will change significantly over time. Such selection is seen as the asymmetric advantage of Bitcoin's trading rules today and trading rules after 5-10 years. Until then, the correlation risk of Bitcoin remained the core market force for a short time, and was the key to understand its potential movement trajectory for many months to come.
Please read the full text here.
Do you like the specific content?Order nowAccept PRO article content directly from the outbox.
Agreement terms:
 Share:Disclaimer:As an open information publishing platform, shilian only represents the author's personal views and has nothing to do with shilian. If the article, picture, audio or video contains infringement, violation or other inappropriate remarks, please provide relevant materials and send it to: 2785592653@qq.com.
Hint:The information provided on this site does not represent any investment suggestion. Investment is risky, and you must be cautious when entering the market.
ShilianFan group:Provide the latest hot news, airdrop candy, red envelopes and other benefits, WeChat: rtt4322.

 Recommended article
-
-